


During motion of the particle its parameters of kinematical analysis (u, v, a, r) change with time. This can be represented on the graph....
During motion of the particle its parameters of kinematical analysis (u, v, a, r) change with time. This can be represented on the graph.
Distance-Time Graphs:
(1) Distance is taken along Y-axis and time along X-axis. A convenient scale is chosen for both the axes. Let AB is a distance-time graph for any moving particle.
 We know speed of a particle is total distance traversed per unit time. Here
\(v = \frac{{total - dis\tan ce - travelled}}{{total - time - taken}}\)
Let us take two instances \({t_1}\) and \({t_2}\) on the distance-time graph when the distance travelled by a object are \({s_1}\) and \({s_2}\) respectively.
So the distance travelled between instances \({t_1}\) and \({t_2}\) is \(\left( {{s_2} - {s_1}} \right)\)and time taken is \(\left( {{t_2} - {t_1}} \right)\).
Therefore \(Speed = \frac{{\left( {{s_2} - {s_1}} \right)}}{{\left( {{t_2} - {t_1}} \right)}} = \frac{{\Delta s}}{{\Delta t}}\) ... ... ... ... ... (i)
Where \(\frac{{\Delta s}}{{\Delta t}}\) is called the slope of distance-time graph.In other words slope of the line obtained in a distance-time graph gives the speed of the object.
Now from triangle ABC,
\(\tan \theta = \frac{{Perpendicular}}{{Base}} = \frac{{BC}}{{AC}} = \frac{{AD}}{{AC}} = \frac{{{s_2} - {s_1}}}{{{t_2} - {t_1}}} = \frac{{\Delta s}}{{\Delta t}}\) ... ... ... ... ... (ii)
Therefore we can write
Speed \(\left( v \right) = \tan \theta \), Where \(\theta \) is the angle between the graph with the X-axis.
So, it is clear that the slope of distance-time graph represents the speed of the particle.
Displacement-Time Graph:
We know that displacement of an object can be negative also while distance is always positive. Thus displacement-Time graph differs from distance-time graph in following manner.
 Here first the objects moves with a constant velocity given by the slope of line OA.
Here Velocity \( = \frac{{AP}}{{OP}}\)
After that object moves with a constant velocity given by the slope of line AC.
Now slope of the line AC \( = \frac{{{s_A} - {s_B}}}{{{t_A} - {t_B}}} = \frac{{6 - 0}}{{3 - 5}} = \frac{6}{{ - 2}} = - 3\)
It is negative.
Here we say the object moves with velocity \( - 3m/s\) i.e. with a velocity 3 m/s in opposite direction. It comes to original position in 5 sec (zero displacement) and then moves to the other side maintaining its velocity
Do You Know: The distance-time and displacement -time graphs of a moving body are similar only when the body moves along a straight line in its positive direction without changing its direction.
Now we show various type of Position-Time graph :
=========================================================================

Here the graph is parallel to X-axis.
So, position is contant with respect to time
Here the angle \(\theta \) is zero
So, \(\tan \theta = 0\)
Slope of the graph is zero
Means speed/velocity \( = zero(0)\)
Therefore we conclude that the particle is in rest with respect to time.
=========================================================================
 Here the graph is parallel to Y-axis.
So angle with the X-axis is \(\theta = 90^\circ \)
So, \(\tan \theta = \tan 90^\circ = \infty \)
So, slope of the graph is \(\infty \)
Means speed or velocity increases at a single time which can not be possible in reaf life situation.
========================================================================
 Here the graph is a straight line passing through origin means has a constant positive slope.
The angle \(\theta \) with the X-axis is constant everywhere but positive.
Here \(\theta \) is positive and the slope \(\tan \theta \) also positive. So the particle runs uniform velocity.
=======================================================================

Here the graph is a straight line means it has constant slope everywhere.Distance-Time Graphs:
(1) Distance is taken along Y-axis and time along X-axis. A convenient scale is chosen for both the axes. Let AB is a distance-time graph for any moving particle.

\(v = \frac{{total - dis\tan ce - travelled}}{{total - time - taken}}\)
Let us take two instances \({t_1}\) and \({t_2}\) on the distance-time graph when the distance travelled by a object are \({s_1}\) and \({s_2}\) respectively.
So the distance travelled between instances \({t_1}\) and \({t_2}\) is \(\left( {{s_2} - {s_1}} \right)\)and time taken is \(\left( {{t_2} - {t_1}} \right)\).
Therefore \(Speed = \frac{{\left( {{s_2} - {s_1}} \right)}}{{\left( {{t_2} - {t_1}} \right)}} = \frac{{\Delta s}}{{\Delta t}}\) ... ... ... ... ... (i)
Where \(\frac{{\Delta s}}{{\Delta t}}\) is called the slope of distance-time graph.In other words slope of the line obtained in a distance-time graph gives the speed of the object.
Now from triangle ABC,
\(\tan \theta = \frac{{Perpendicular}}{{Base}} = \frac{{BC}}{{AC}} = \frac{{AD}}{{AC}} = \frac{{{s_2} - {s_1}}}{{{t_2} - {t_1}}} = \frac{{\Delta s}}{{\Delta t}}\) ... ... ... ... ... (ii)
Therefore we can write
Speed \(\left( v \right) = \tan \theta \), Where \(\theta \) is the angle between the graph with the X-axis.
So, it is clear that the slope of distance-time graph represents the speed of the particle.
We know that displacement of an object can be negative also while distance is always positive. Thus displacement-Time graph differs from distance-time graph in following manner.

Here Velocity \( = \frac{{AP}}{{OP}}\)
After that object moves with a constant velocity given by the slope of line AC.
Now slope of the line AC \( = \frac{{{s_A} - {s_B}}}{{{t_A} - {t_B}}} = \frac{{6 - 0}}{{3 - 5}} = \frac{6}{{ - 2}} = - 3\)
It is negative.
Here we say the object moves with velocity \( - 3m/s\) i.e. with a velocity 3 m/s in opposite direction. It comes to original position in 5 sec (zero displacement) and then moves to the other side maintaining its velocity
Do You Know: The distance-time and displacement -time graphs of a moving body are similar only when the body moves along a straight line in its positive direction without changing its direction.
=========================================================================

Here the graph is parallel to X-axis.
So, position is contant with respect to time
Here the angle \(\theta \) is zero
So, \(\tan \theta = 0\)
Slope of the graph is zero
Means speed/velocity \( = zero(0)\)
Therefore we conclude that the particle is in rest with respect to time.
=========================================================================

So angle with the X-axis is \(\theta = 90^\circ \)
So, \(\tan \theta = \tan 90^\circ = \infty \)
So, slope of the graph is \(\infty \)
Means speed or velocity increases at a single time which can not be possible in reaf life situation.

The angle \(\theta \) with the X-axis is constant everywhere but positive.
Here \(\theta \) is positive and the slope \(\tan \theta \) also positive. So the particle runs uniform velocity.
=======================================================================
The angle \(\theta \) with the X-axis constant everywhere but negative.
Here \(\theta \) is negative means the slope \(\tan \theta \) is also negative.
Here the particle runs with uniform velocity.
2. The angle \(\left( \theta \right)\) with the X-axis is increasing means \(\tan \theta \) is increasing.
3. \(\tan \theta \) is increasing means slope of the graph increasing.
4. Slope of the graph is also increasing means velocity or speed is increasing.
5. Since velocity is increasing so, acceleration \(\left( a \right)\) is positive.
========================================================================

2. The angle \(\theta \) with X-axis decreasing means \(\tan \theta \) is decreasing.
3. \(\tan \theta \) is decreasing means slope of the graph is decreasing.
4. Slope of the graph decreasing means speed or velocity is decreasing.
5. Since velocity is decreasing , acceleration of the particle is negative.

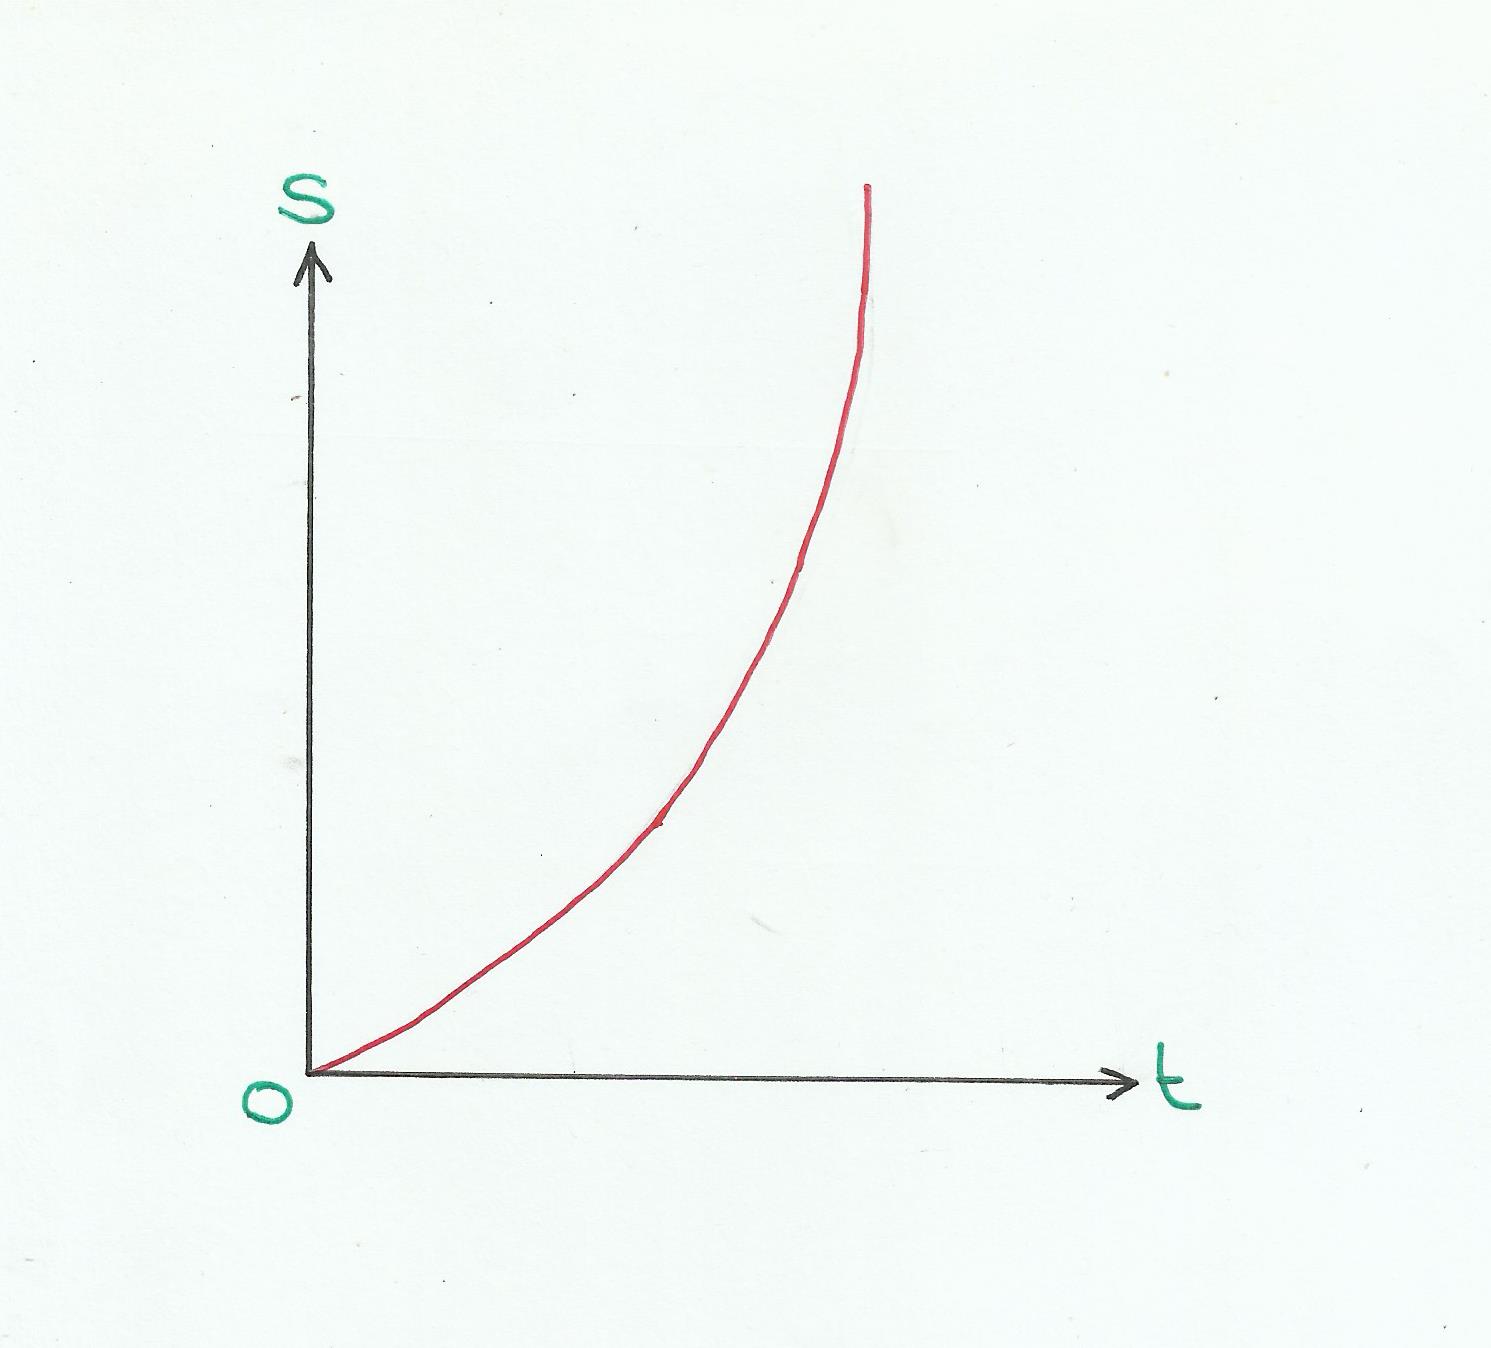
1. Here the position S is increasing means velocity \(\left( v \right)\) is positive
2. The angle \(\theta \) with the X-axis is decreasing means \(\tan \theta \) is decreasing.
3. \(\tan \theta \) is decreasing means slope of the graph decreasing.
4. Slope of the graph decreasing means velocity of the particle decreasing.
5. Since velocity is decreasing means, acceleration of the particle is negative.

2. The angle \(\theta \) with the X-axis is increasing means \(\tan \theta \) is increasing.
3. \(\tan \theta \) is increasing means slope of the graph increasing.
4. Slope of the graph increasing means velocity of the particle increasing.
5. Since velocity of the particle is increasing means acceleration is positive.
======================================================================

=======================================================================


=========================================================================
========================================================================

Distance & Displacement: The area covered between the velocity time graph and time axis gives the displacement and distance of the of the particle for a given time interval.
Then the Total distance traversed \( = \left| {{A_1}} \right| + \left| {{A_2}} \right| + \left| {{A_3}} \right|\)
\( = \) Addition of modulus of different area i.e. \(\int {\left| v \right|dt} \)
And the total displacement \( = {A_1} + {A_2} + {A_3}\)
\( = \) Addition of different area considering their sign i.e. \(r = \int {vdt} \)
Here \({A_1}\) and \({A_2}\) are the area of a triangle 1 and 2 respectively and \({A_3}\) is the area of a trapezium.
Calculation Acceleration From Velocity-Time Graph:

Let AB is a velocity-Time graph for any moving particle.
As acceleration \( = \frac{{change - in - velocity}}{{total - time - taken}} = \frac{{{v_2} - {v_1}}}{{{t_2} - {t_1}}} = \frac{{\Delta v}}{{\Delta t}}\) ... ... ... ... ... ... (i)
Again from triangle ABC,
\(\tan \theta = \frac{{BC}}{{AC}} = \frac{{AD}}{{AC}} = \frac{{{v_2} - {v_1}}}{{{t_2} - {t_1}}} = \frac{{\Delta v}}{{\Delta t}}\) ... ... ... ... ... ... ... (ii)
From equation (i) and (ii) we can write
slope of a velocity-time graph represents acceleration of the objects.
Thus acceleration of a particle is the slope of a velocity-time graph and the slope \(m = \tan \theta \), where \(\theta \) is the angle between the graph with the time axis.
Now we show various type of Speed-Time graphs or Velocity-Time Graphs :
========================================================================

So, velocity is constant with respect to time
Here the angle \(\theta \) is zero
So, \(\tan \theta = 0\)
Slope of the graph is zero
Means Acceleration \( = zero(0)\)
Therefore we conclude that the particle is in uniform velocity.
========================================================================

So, \(\tan \theta = \tan 90^\circ = \infty \)
So, slope of the graph is \(\infty \)
Means Acceleration of the particle is infinity, which can not possible in real life situation.
========================================================================

The angle \(\theta \) with the X-axis is constant everywhere but positive because \(\theta < 90^\circ \) So, here \(\theta \) is positive and the slope \(\tan \theta \) also positive. So the particle runs in uniform Acceleration

So, Here the particle is in constant positive acceleration with a positive initial velocity.
========================================================================

=========================================================================

=========================================================================

Here the Graph is straight line means \(\theta \) is constant but \( > 90^\circ \), means slope is negative and with an initial positive velocity. So, the particle is in constant negative acceleration with an initial positive velocity.
=========================================================================

Here the Graph is straight line means \(\theta \) is constant but \( > 90^\circ \), means slope is negative and with an initial negative velocity. So, the particle is in constant negative acceleration with an initial negative velocity.

1. Here Velocity V is increasing means velocity \(\left( v \right)\) is Positive.
2. The angle \(\left( \theta \right)\) with the X-axis is increasing means \(\tan \theta \) is increasing.
3. \(\tan \theta \) is increasing means slope of the graph increasing.
4. Slope of the graph is also increasing means acceleration is increasing.
=========================================================================

2. The angle \(\theta \) with X-axis decreasing means \(\tan \theta \) is decreasing.
3. \(\tan \theta \) is decreasing means slope of the graph is decreasing.
4. Slope of the graph decreasing means Acceleration is decreasing.
=========================================================================

3. \(\tan \theta \) is decreasing means slope of the graph decreasing.
4. Slope of the graph decreasing means Acceleration of the particle decreasing.
=========================================================================

2. The angle \(\theta \) with the X-axis is increasing means \(\tan \theta \) is increasing.
3. \(\tan \theta \) is increasing means slope of the graph increasing.
4. Slope of the graph increasing means Acceleration of the particle increasing.
=========================================================================
SOME CONCEPTUAL BASED QUESTION: TRY YOURSELF
=========================================================================

Question: A ball is thrown vertically upwards. Which of the following plots represents the speed-time graph of the ball during its flight if the air resistance is ignored.
=========================================================================

Question: A ball is thrown vertically upward which of the following graph represents velocity time graph of the ball during its flight (Air resistance is neglected)
(a)
(b)
(c)

(a) 200
(b) 250
(c) 300
(d) 400
=========================================================================

(a) \(\frac{1}{2}\)
(b) \(\frac{1}{4}\)
(c) \(\frac{1}{3}\)
(d) \(\frac{2}{3}\)
=========================================================================

(a) 8 m, 16 m
(b) 16 m, 8 m
(c) 16 m, 16 m
(d) 8 m, 8 m
=========================================================================


COMMENTS